How much revenue does user-generated content actually drive? That’s the question behind the Flowbox UGC Impact Report 2026, and after six months of data collection and analysis, the answers are in.
The Flowbox UGC Impact Report 2026 is our most comprehensive analysis of how user-generated content affects eCommerce revenue. Based on observed sales data from 315 brands across seven industries and nine European regions, the report moves past opinion and into measurable outcomes.
If you’ve been trying to quantify what UGC actually does for conversion rates, average order values, and overall revenue, this is the dataset to start with.
Download the Flowbox UGC Impact Report 2026
Why we built this report
UGC has been part of the eCommerce conversation for years. Most marketers know it matters. But when it comes to building a business case, the conversation usually stalls at “it builds trust” or “customers like seeing real photos.” That’s not enough to secure budget, prioritise placement decisions, or set realistic expectations for what UGC will deliver for your specific brand.
We wanted to change that. So we turned inward, to the data sitting inside the Flowbox UGC platform, and asked a simple question: across the brands using Flowbox, what is UGC actually doing to their sales numbers?
Discover how UGC can impact your brand’s revenue.
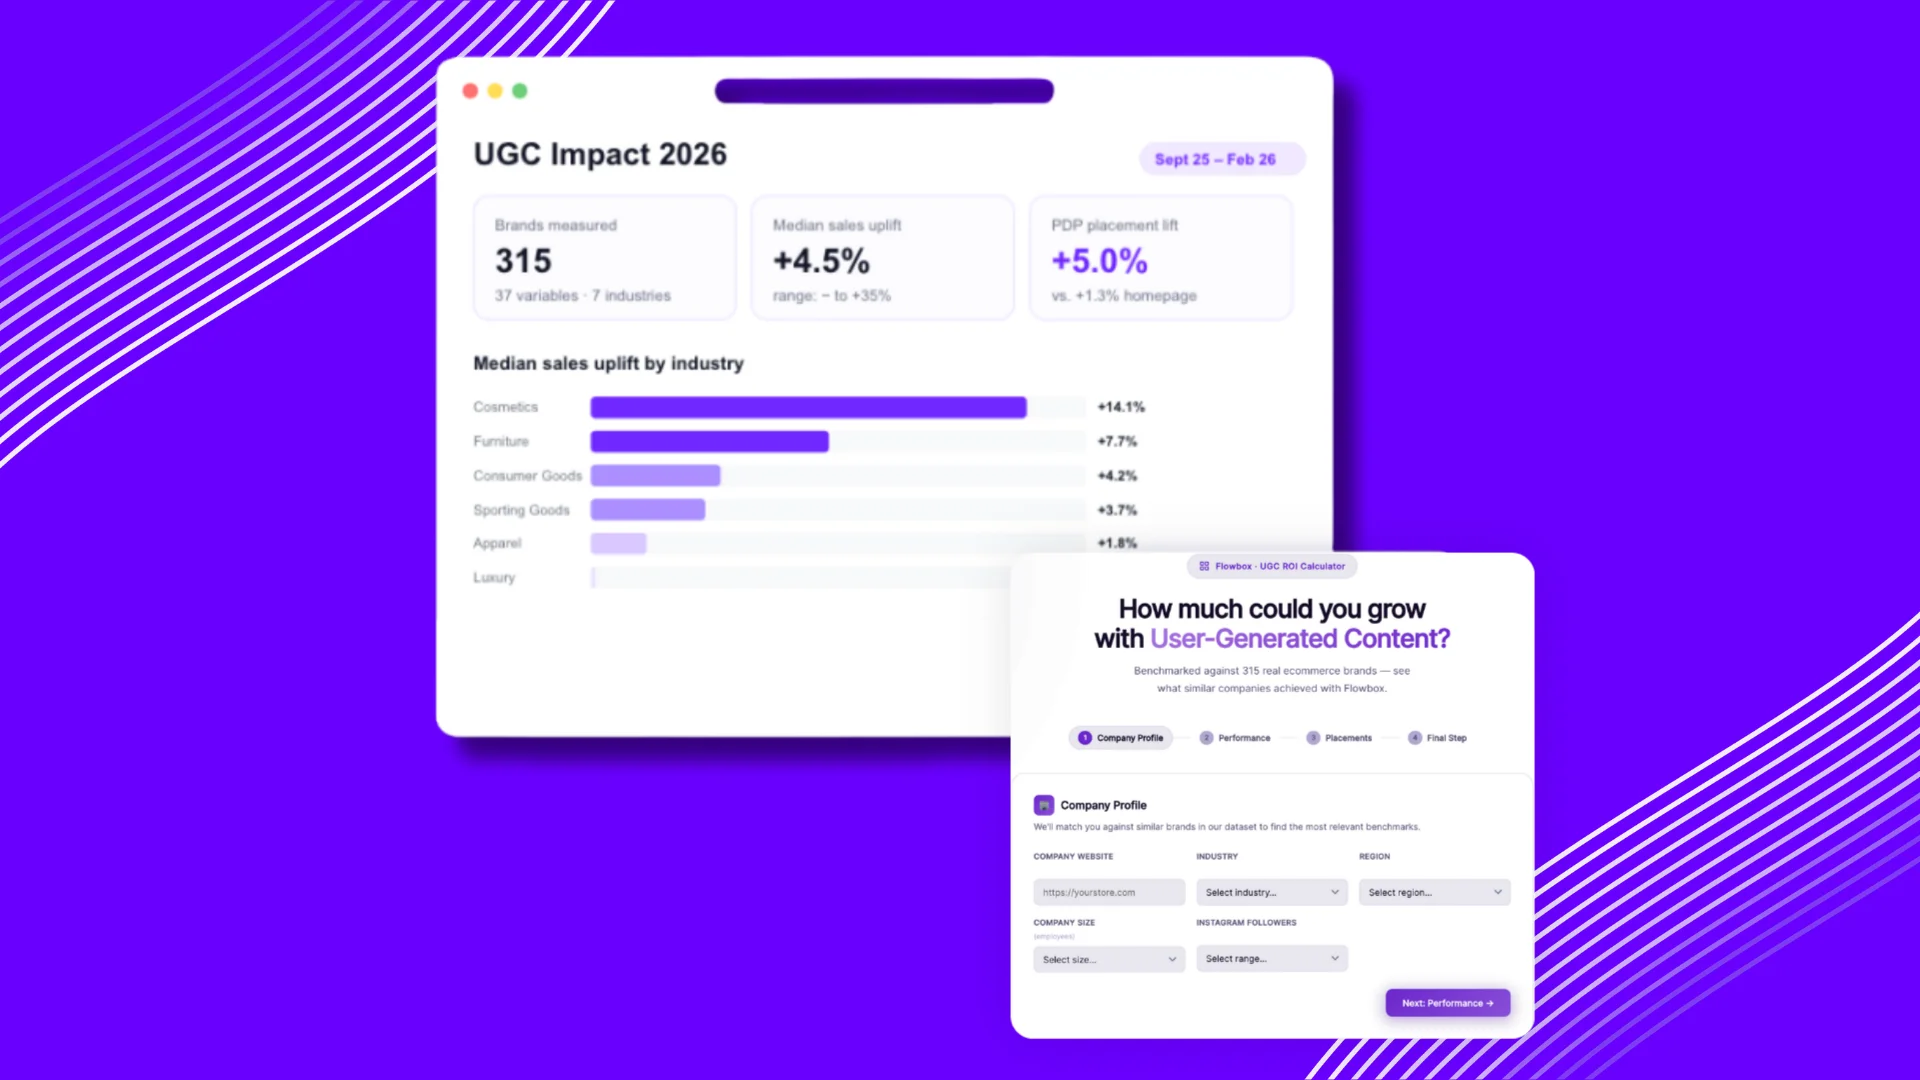
Don’t know if UGC is worth the investment? The ROI Calculator gives you a personalised revenue projection in under a minute — benchmarked against 315 real ecommerce brands.
Try the ROI calculator
What’s inside the report
The Flowbox UGC Impact Report 2026 analyses observed sales data from 315 eCommerce brands tracked between September 2025 and February 2026. The dataset covers 37 variables per brand, 7 industries, and 9 European regions. All findings are modelled with cross-validated ridge regression on log-transformed targets.
Here’s what the report covers:
- The real sales uplift range. Not a single average, but the full spectrum: from brands that saw negative returns to those exceeding +35%. You’ll see exactly what separates the two groups.
- The single strongest predictor of UGC impact. One metric in your analytics dashboard right now tells you more about your expected UGC return than your industry, company size, or region. The report reveals what it is and provides benchmarks by bracket.
- Placement performance, ranked. Not all pages are equal. The report quantifies the sales uplift difference between four common UGC placements, and the gap is larger than most teams expect.
- The AOV effect most brands miss. UGC doesn’t just convert more visitors. It changes what they spend. The report shows the multiplier by industry and explains why the revenue impact is compounding, not linear.
- Industry-by-industry benchmarks. Median uplift, percentage of brands clearing key thresholds, AOV multipliers, and sample sizes for cosmetics, furniture, consumer goods, sporting goods, apparel, and luxury.
- Regional differences across Europe. UGC performs differently depending on the market. The report identifies which European regions show the strongest correlation between UGC and conversion.
Real brands, real results
The report also includes seven case studies from Flowbox customers putting these findings into practice:
- ScS, a UK furniture retailer, saw a 4.1x higher conversion rate for UGC-assisted visitors and a 3.84% overall site conversion rate increase.
- G-Star tested UGC inside Dynamic Product Ads and saw an 18% conversion rate increase alongside a 16% improvement in ROAS.
- Pink Gellac, a cosmetics brand operating across seven European countries, grew UGC from 10% to 40% of all social content after adopting Flowbox, with a 9.40% increase in average order size for UGC-assisted users.
Each case study connects back to the data, showing how the benchmarks translate into real-world outcomes across different industries and markets. Download the full report to discover additional case study insights.
Who this report is for
If you’re an eCommerce or marketing manager trying to answer any of these questions, the report was built for you:
- Is UGC worth the investment for my industry and market?
- Where should I deploy UGC first to see the fastest return?
- What’s a realistic uplift expectation given my current conversion rate?
- How do I build a business case my leadership team will approve?
The data covers 7 verticals and 9 regions, so whether you sell furniture in the UK, cosmetics in France, or sporting goods in DACH, there’s a benchmark in here that maps to your situation.
What to do with this data
The UGC Impact Report is designed to help you make a business case, not just read about benchmarks. Three concrete next steps come out of it.
- First, run your numbers in the Flowbox ROI Calculator, which uses the same dataset to generate a personalised revenue projection based on your industry, region, baseline CR, and AOV.
- Second, identify where UGC will have the most impact for your specific situation, using baseline conversion rate as your starting filter.
- Third, if you want a strategy built around your brand’s market and goals, the Flowbox team can map your profile against the full dataset.
Ready to see what UGC could deliver for your brand? Request a demo and let the Flowbox team build a strategy around your numbers.